Stacking Procedure
This page describes the WIRwolf data pipeline. The pipeline can be broken down into the following components:
- Image grouping
- Astrometric calibration
- Photometric calibration
- Sky background subtraction
- Resampling and coaddition
- Catalogue generation
Image grouping
The images are grouped according to the following criteria:
- The centres of the images in a group must be at most 0.1 degrees apart.
- There must be at least 3 image slices taken in a single filter. WIRCam data is often taken as a data cube, where multiple short exposures are taken in sequence. For WIRwolf, the data is processed at the slice level. A slice consists of four extensions, one per WIRCam detector, held in a Multi-Extension FITS (MEF) file.
- Images taken in other filters are included in the group if there are 3 or more slices taken in each filter.
Many of the WIRcam images are data cubes. All are MEF files with 4 extensions, corresponding to the 4 detectors. Before further processing, each WIRcam image is split into its component extensions and split along the third (time) axis. The four corresponding slices are then reassembled to make a MEF. This time however each file corresponds to a single slice in time.
Astrometric calibration
The WIRwolf astrometric calibration is very similar to that for MegaPipe. The AstroGwyn astrometric calibration pipeline is run on the images. The first step is to run SExtractor on each image. The parameters are set so as to extract only the most reliable objects (5 sigma detections in at least 5 pixels). This catalogue is further cleaned of cosmic rays and extended objects. This leaves only real objects with well defined centres: stars and (to some degree) compact galaxies.
This observed catalogue is matched to the 2MASS catalogue. The (x,y) coordinates of the observed catalogue are converted to (RA, Dec) using the initial 'I'iwi WCS. The catalogues are shifted in RA and Dec with respect to one another until the best match between the two catalogues is found. If there is no good match for a particular CCD (for example when the initial WCS is erroneous), its WCS is replaced with a default WCS and the matching procedure is restarted. Once the matching is complete, the astrometric fitting can begin. Typically 20 to 50 sources per CCD are found with this initial matching.
'I'iwi provides a first order solution for the WCS with typical errors on the order of 1 arcsecond. AstroGwyn improves on this to provide a higher order solution with an accuracy of typically 0.1 arcseconds. As the accuracy of the WCS improves, the observed and reference catalogues are compared again to increase the number of matching sources. A larger number of matching sources makes the astrometric solution more robust against possible errors (proper motions, spurious detections, etc.) in either catalogue.
The higher order terms are determined on the scale of the entire mosaic. That is to say, the distortion of the entire focal plane is measured. This distortion is well described by a polynomial with second and fourth order terms in radius measured from the centre of the mosaic. The distortion appears to be stable over time, even when some of the MegaPrime optics are flipped. Determining the distortion in this way means that only 2 parameters need to be determined (the coefficients of r2 and r4) with typically (20-50 stars per chip) * (36 chips) =~ 1000 observations. If the analysis is done chip-by-chip, a third order solution requires (20 parameters per chip)*(36 chips)= 720 parameters. This is less satisfactory.
From the global distortion, the distortion local to each CCD is determined. The local distortion is translated into a linear part (described by the CD matrix) and a higher order part (described by the PV keywords). The CD/PV transformation was described in detail in an appendix that was removed from first draft of the MegaPipe paper. The higher order part is 3rd order as well, but the coefficients depend directly and uniquely on the 2 parameter global radial distortion. The error introduced by this translation is less than 0.001 arcseconds.
The data from the different filters are processed in order of wavelength, starting with the J-band. The data from first filter to processed is matched to 2MASS, photometrically calibrated and stacked (as described below). Data from the subsequent bands are matched to a catalog extracted from the stacked images in the first band.
The results are internal uncertainties of 0.04 arcseconds and an external uncertainty of about 0.17 arcseconds, as discussed on the checks on astrometry page.
Photometric calibration
The first step in the development of the photometric calibration was to decide what sort of magnitudes to measure. The "industry standard" for galactic photometry is MAG_AUTO, a Kron-type magnitude. WIRwolf uses the 2MASS survey, in particular the Point Source Catalog, as a photometric reference. However, for stellar photometry, fixed circular apertures, ideally measured through a small aperture but corrected to a larger aperture are superior.
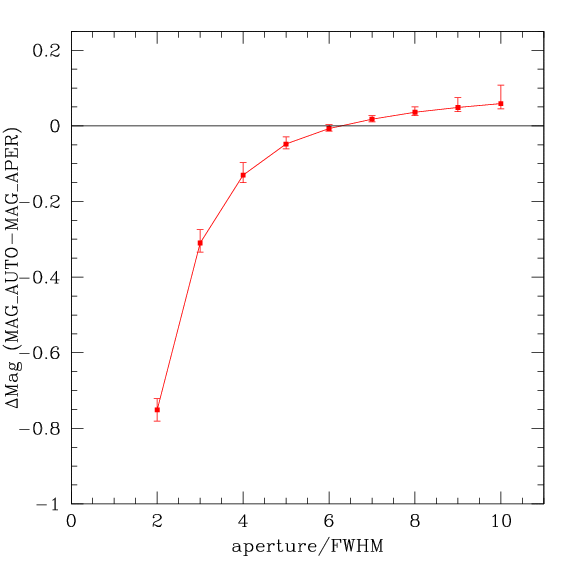
The solution is to pick a fixed aperture which produces on average the same magnitude as MAG_AUTO for point sources. 130000 WIRcam images were examined. The image quality FWHM was determined. MAG_AUTO was measured as well as magnitudes measured through a series of apertures, all multiples of the FWHM.
The difference between the aperture magnitudes and MAG_AUTO is shown below. The error bars represent the 90%-tile limits. The plot shows that an aperture of just over 6 times the FWHM will yield a magnitude that is on average the same as MAG_AUTO. The exact coefficient is 6.28, suspiciously close to 2π.

This aperture was adopted as the reference aperture. However this aperture is large enough that the sky will induce significant noise. Therefore, the photometry was measured through an aperture half this size and corrected to the full 6.28 FWHM aperture.
Having measured the instrumental magnitudes, the next step is to compare with 2MASS. The 2MASS survey is somewhat shallower than most WIRcam images. There is very little overlap between the faintest sources visible in 2MASS and the brightest, non-saturated sources in WIRcam images.
The point sources in the WIRcam images are identified by determining the half-light radius for each source. The point sources in the WIRcam image slices are matched to the 2MASS catalog. The 2MASS magnitudes are converted on the WIRcam photometric system using the colour terms described on the WIRcam filters page.
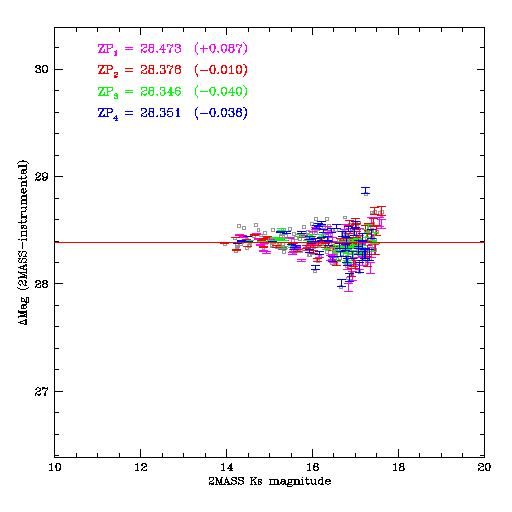
The figure below shows a typical match with 2MASS. The scatter is considerable; note the scale of the vertical axis. The four WIRcam chips do not have the same zero-point. Note the zero-point differences in parentheses.

While it highly desirable to have a good absolute calibration, it is absolutely vital to have the best possible internal calibration in order to properly combine the images. Consequently, after the individual images were calibrated to 2MASS, the resulting individual catalogs for each image group are merged. The absolute calibration of the merged master catalog will be better than any of the individual catalogs by a factor of √N images.
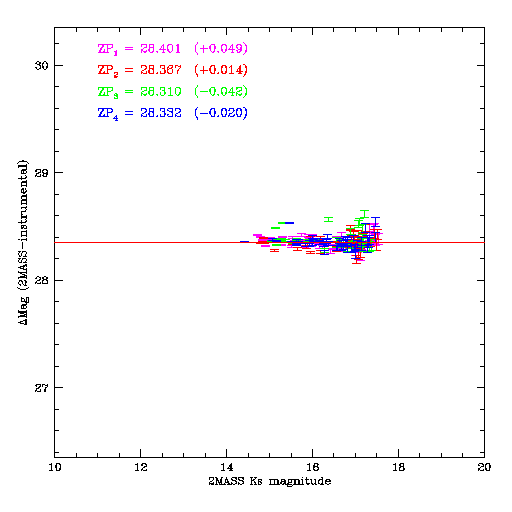
Each image slice is then matched to the merged catalog. The result is a considerably tighter relation, as shown below. The typical zero-point errors between slices in a group is better than 0.003 magnitudes.
Sky background subtraction
A substantial amount of the work of background subtraction is done by 'I'wii as described in the 'I'wii background subtraction documentation. The 'I'wii procedure uses images taken before and after in the image in question on the same night to build a background, and then subtracts it from the image. Indeed, particularly in the case of fields with extended sources (large galaxies, nebulae) it would be hard to do better. However, in fields without extended sources (most WIRcam images) it is possible to do slightly better by perform a local background subtraction.
SExtractor is run on each image slice. The Kron ellipses for each detected source are used to mask the original image. SExtractor is run again on the masked image slice this time generating a background map as a check image (using the -CHECKIMAGE_TYPE BACKGROUND option). This background is subtracted from the image
Resampling and coaddition
The images are resampled with SWarp. A pixel grid that contains all the images is set up by running SWarp once to generate a header. The pixel size is set to 0.3 arcseconds per pixel. Each background-subtracted image slice is then SWarped on to this grid. Here is the swarp configuration file. The resampling is done with LANCZOS2 kernel.
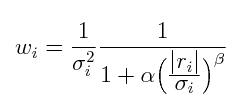
The resampled images are coadded using a artificial skepticism algorithm. Artificial Skepticism (Stetson 1989) is a method of computing a robust average image using a continuous weighting scheme that is derived from the data themselves. The weights are given by:

where wi is the weight of the i-th input pixel, σi; is the standard deviation (determined by the read noise and gain), ri is the residual of i-th input pixel with respect to the current average value. The method uses a median as the starting point. Weighted averages are then computed using the equation above iteratively. Pixel values that fall far from the average will be given less weight (ri is larger so wi becomes smaller) in each successive iteration. The equation can be tuned using the free parameters α and β. Here they are set to α=1 and β=2, as used the WFPC2 pipeline. After a few iterations (both WIRwolf and the WFPC2 pipeline stop at 5 iterations) the procedure converges. If there is a defective pixel (e.g affected by a cosmic ray) in the list, the weight for the pixel will be such that it contributes negligibly to the output. If there are no defective pixels, all the pixels will be weighted roughly equally. This is different then a sigma clipping method in that there is no hard, discrete cutoff defining when a pixel is "good" or "bad". Pixels are rejected gradually as they deviate from the central value. Artificial skepticism is offers better noise characteristics than a median and superior outlier rejection then either an average or a median.
The resulting stacks measure about 5000 by 5000 pixels, depending on the input dither pattern. They have a sky level of 0 ADU. They are scaled to have a photometric zero-point of 30.000 in AB magnitudes - that is to say, for each source:
AB_magnitude = -2.5 * log10(counts) + 30.000
A weight map (inverse variance) of the same size is also produced from the artificial skepticism weights.
Catalogue generation
SExtractor is run on each stack using the weight map. Here is the SExtractor configuration file. The resulting catalogues only pertain to a single band image; no multi-band catalogues have been generated. While this fairly simple approach works well in many cases, it is probably not optimal in some situations. Depending on the application, some users may wish to run their own catalogue generation software on the stacks.
- Date modified:
